
GPA, test scores, extracurriculars, essays, class rank, course rigor, letters of recommendation. All of these are factors that colleges may consider when choosing which students will be a part of their new class.
However, it is undeniable that a student’s statistics, referring to their GPA and standardized test scores (SAT or ACT), remain the most straightforward way to compare with their peers, as they are quantitative. These measures provide a basis for evaluating a students’ academic performance without much context, as GPA and test scores are generally standardized. While extracurriculars and essays are also considered, they are subjective and diverse, making it much harder to create direct comparisons.
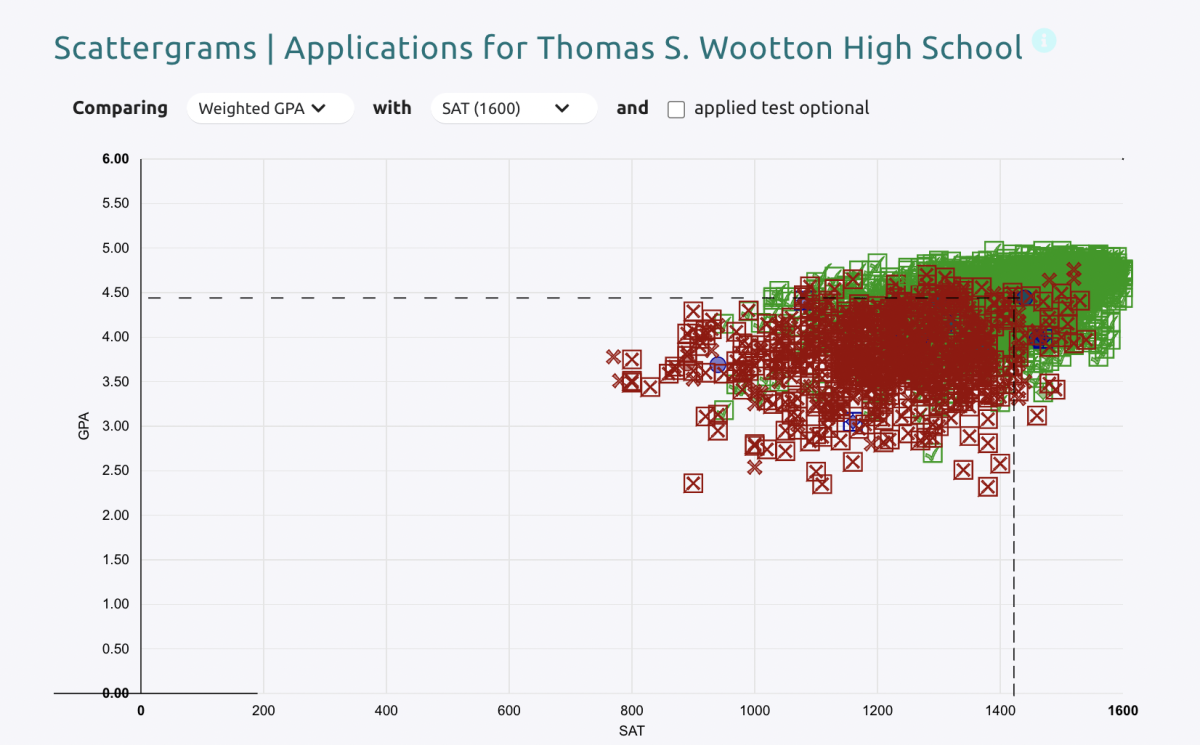
A common way for students in MCPS to see how they measure among their peers in terms of their stats is through the website Naviance. Naviance is used by students starting in middle school for college and career information. For juniors and seniors, one of its most used features include the scattergrams where past Wootton students are plotted by their GPA and test score and indicated based on if they got accepted, waitlisted or rejected to a specific school. The question arises: Is this a good enough metric to use to determine whether a student will get into a school or not?
While Naviance aims to provide insights, the accuracy of its data could raise concerns. “The information is updated every year to reflect the past 10 years. However, most of the data is to a certain extent reflective of students’ self-reported information. This is especially true of the accepted, waitlisted, denied information,” college and career counselor Jennifer Macdonald said.
Despite this, students admit to checking Naviance frequently. “I checked pretty often toward the end of junior year and beginning of senior year because I was very nervous about my chances,” senior Samantha Lau said. “But, I eventually realized that nothing was changing so I let it be.”
Lau applied restrictive early action to Stanford University and was accepted in December. “In the end the graphs didn’t influence where I wanted to go. I knew that Stanford would be my dream school so regardless of the scatter graphs I was going to apply,” Lau said. “Although it ended up not influencing my decision, it did make me feel less confident in my chances of getting accepted because there were many applicants with higher stats than mine that were rejected.”
Macdonald agrees with Lau’s approach, stating that one should apply to a dream school if feasible even if they are an outlier on the graphs. “Even if the graph might make you seem like an outlier for a school you especially love, you can still apply yet have a realistic sense of your chance for admission, ” Macdonald said.
While Naviance can make students nervous about whether they will be accepted, it can also have the opposite effect and make students overconfident. This was more commonly seen when the University of Maryland, College Park, early action decisions came out in January. “I was decently confident I’d get accepted because my stats put me in the green section in Naviance. I was pretty surprised when I was rejected,” an anonymous senior said.
While the Naviance graphs should not be the only thing that students look at or think about when determining what colleges they can and can’t get into, it can be an indicator for a reasonable chance of admission. “I think the graphs are more helpful for students trying to determine whether a school is the right fit for them. If you are not particularly knowledgeable about a school, you can use the graphs to assess how you compare to a typical accepted applicant,” Macdonald said.