
Inflation brings doom and gloom
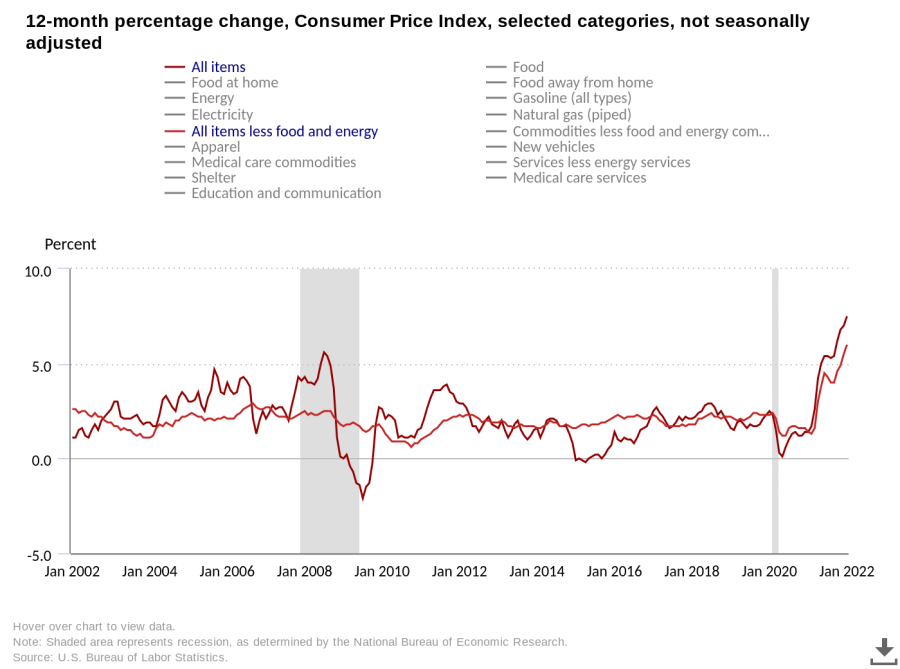
Graph courtesy Bureau of Labor Statistics
Consumer Price Index readings translated into an inflation rate of 7.5% (6% for core inflation), a number not seen since 1982.
A 15% increase in the price of an eight-pack of my favorite gum at Target is not indicative of inflationary pressures (it only indicates a very grumpy me). A 7.5% year-over-year increase in the price tag consumers see, however, certainly is. Jan. 2022’s Consumer Price Index numbers indicated just that: a 7.5% increase in the price of a basket of typical consumer goods. It’s the highest inflation rate the U.S. has seen since CPI numbers hit 7.6% in February 1982, and it’s showing no signs of slowing down.
When the Fed “prints” money…
In the face of the pandemic, the Federal Reserve was tasked with stimulating the economy through open market purchases – where the Fed buys short-term U.S. Treasury securities from commercial banks – and quantitative easing, where the Fed buys long-term U.S. Treasury securities in addition to private securities such as mortgage-backed securities. These methods increase the money supply by providing commercial banks with excess reserves (cash over the required amount the bank must keep). With their excess reserves, banks will lend out more money at a lower interest rate, promoting borrowing and spending. As you can see from the following graph, the Fed has expanded its balance sheet (its System Open Market Account or SOMA) plenty during the pandemic, increasing SOMA holdings from roughly $3.73 trillion on January 8, 2020, to $8.36 trillion effective February 16, 2022:
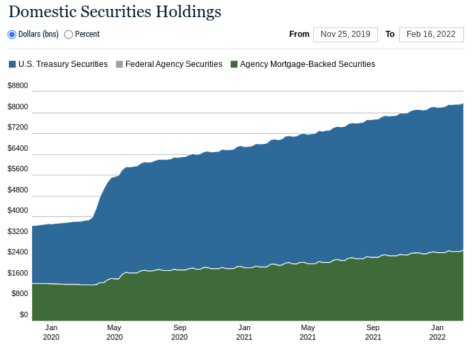
(Balance sheet on the Federal Reserve’s System Open Market Account courtesy of the Federal Reserve Bank of New York)
In short, the Fed created money out of thin air, which had the same effect as printing money (the Fed can’t actually print money, but it can tell the Bureau of Engraving and Printing to do so). More money leads to higher aggregate demand, which leads to higher price levels. Now, the Fed is tapering their bond-buying program and will start shedding the trillions of dollars in bonds its balance sheet holds, practically removing the money it created in the first place and lowering the money supply, which decreases borrowing and spending and thus calms down inflation.
…and the government spends like there’s no tomorrow…
In the beginning of the pandemic, real GDP plummeted 8.9% between the first and second quarters of 2020 as a result of increasing lockdowns and overall pessimism due to what would eventually be the ensuing COVID-19 pandemic. The federal government was quick to act with a series of stimulus packages that at the time seemed necessary. Close to $6 trillion in COVID relief was passed throughout the several rounds of government stimulus spending under both the Donald Trump and Joe Biden administrations. Whether it was effective or not is a different story. Regardless, the effect of stimulus money on the budget deficit was massive, by leading the U.S. to the highest deficit ever at $3.1 trillion in 2020, as shown here:
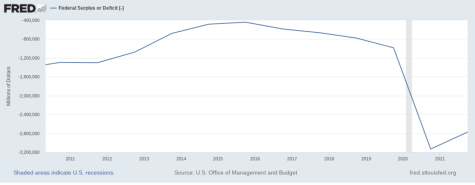
(Graph on the Federal Surplus or Deficit courtesy of the Federal Reserve Bank of St. Louis’ Federal Reserve Economic Data, or FRED)
A budget deficit is self-explanatory: the government is spending more than it is bringing in. It’s perfect fiscal policy for combating a recession like the one brought on by the pandemic. When overdone, however, the increase in price levels, brought on by the increase in government spending, can pick up the pace and lead to inflationary periods like the one we are seeing today. Inflationary concerns are what killed Biden’s Build Back Better plans as the thought of even more government spending worries lawmakers like Senators Joe Manchin (D-WV) and Krysten Synema (D-AZ), two key votes the Democrats need if they want any hope of passing any legislation.
…when tomorrow comes, it’s 7.5% more expensive.
The government’s goal, as well as the Fed’s goal, of taming the pandemic recession certainly did its job. Unfortunately, it comes at the cost of higher gas, groceries, and my favorite pack of gum, of course. Though, it’s important to mention that the first two are price volatile by nature, which is why the CPI measures what it calls its “core inflation,” which is the price level of goods minus food and energy. Even then, core inflation measured at 6% in January. Students like senior Thomas Mitri have been seeing the brunt of inflation. “Everything costs more. I have to be more frugal with my spending. When I go fishing and have to reload my gas tank, gas costs a lot,” Mitri said.
Junior Richard McDaniel’s lighter wallet discourages him from going out as often, too. “I don’t spend that much in the first place, but when I do participate in excursions, especially at restaurants, the price differences are simply astonishing. I’ll still buy it, I just can’t rely on knowing the cost of what I actually buy,” McDaniel said.
Supply chain shortages are still proving a real effect on the economy (less supply can also lead to higher prices), but the Fed has recognized that the inflation we’re seeing is proving to be more likely than not the result of demand-pull inflation (where too much money is chasing too few goods). As we mentioned, the Fed is ready to act (perhaps aggressively), but the pain is likely here to stay as the process of the Fed’s balance sheet shedding will take a while to go into effect. In the meantime, whether you’re filling up the Wrangler, devouring the Coastal Flats bread rolls, buying the latest iPhone, or updating your wardrobe, expect it to hurt your wallet an extra 7.5%, and maybe more into the future as the worst may be yet to come.
Your donation will support the student journalists of Thomas S. Wootton High School. Your contribution will allow us to purchase equipment and cover our annual website hosting costs.
Joaquin Moreno is a 2022 graduate. When he's not writing articles, Joaquin enjoys playing on his viola, cooking and baking, and rooting for either...